Digitising the Analogue

In collaboration with my colleague, Eva Andersen.

Some time ago it suddenly hit us that it has been a while since we read an academic book or article in a physical format. This for the simple reason that we can retrace digital information much quicker — i.e. annotating a PDF, extracting highlighted text automatically with ZotFile or quickly looking up a specific word in a pdf document. A second realisation was that as PhD students in the field of digital history and hermeneutics these “small” digital aspects of a scholars life are almost never highlighted.

When we talk about the digital turn, most people think about large-scale digitisation of historical sources and the use of computational tools and techniques such as social network analysis, text mining, natural language processing, linked open data as well as the still often used Excel or Access file. Digital humanists will not be surprised by this brief selection of methods and tools which are also often critically analysed and discussed during conferences and are slowly being teached more and more in the classroom. Websites such as the programming historian offer other interesting examples and practical explanations of different techniques.

However, as PhD students we are constantly confronted by a quite trivial but important gap between the analogue (rapidly scribbling down ideas about our research or information about sources on a stray piece of paper) and the digital world (the earlier mentioned tools and computer folders full of digitised sources and literature). In our research process we use elements of both worlds and sometimes these clash, warranting researchers to think about how to handle this. For example, reading a pdf on your computer is easy for when you quickly want to find a specific paragraph. But what with the ‘analogue technique’ of writing down remarks in the sidelines of an article or circling keywords? This is not easily accomplished on a screen. Different options such as adding ‘balloon comments’ to a PDF or inserting text boxes come to mind, but are not the same as handwritten observations.

We briefly want to reflect on how we try to bridge this gap. The previous months we have tested some tablets that could close the gap between the analogue and the digital, namely the iPad Pro accompanied with the Apple Pencil and the E-ink tablet reMarkable. Below you find some of our remarks focused on the researchers environment. We will also say a bit more about Zotero and its add-on Zotfile that could be quite useful.

Reflections on iPad and reMarkable.

The iPad Pro offered several applications for note taking, such as the free and pre-installed Apple Notes, or paying GoodNotes and Nebo. Furthermore, Nebo also makes handwriting recognition possible and can translate written notes into “typed” notes. Another plus for the iPad are the PDF viewers that work easily with the Apple pencil, allowing different colours for notes as well as supporting the extraction of text to Zotero. This ‘annotation extraction’ is made possible by a plug-in for Zotero called Zotfile. Furthermore it allows you to gather your PDF’s in a folder on your computer — if you use a service like Dropbox your PDF’s even get updated regardless of which device you use — rather than making use of the limited Zotero storage space. Depending on the applications you use on the iPad, pages can be put into different folders and all your thoughts are in one place so that you do not need to search for separate notes and post-its on your desk. In most applications you can also select different layouts to write on, although this is also possible on the reMarkable, but more on that device later. Finally, linking, syncing and using existing folder structures within applications such as Dropbox is easy. One major downside of the iPad Pro, is the backlit screen which can strain your eyes after a while. The surface to draw on is also less ‘paperlike’ because it’s made of glass — although ‘paper like’ screen protectors exist — and the iPad uses more battery than the reMarkable. Eva mostly used the iPad to scribble notes for remembering a specific name or footnote numbers to go back to after reading, or for creating to do lists. The iPad made it possible for her to gather all sorts of notes such as the number of hours she worked or ideas she had in one place.

The most obvious advantage of the reMarkable was it’s e-ink technology that made it easy to read several articles without straining your eyes. However, reading digitised sources is not always that convenient because of the scan quality. ReMarkable also gathers all your thoughts in one place which can be sorted into different notebooks or different folders . We both found that the paper-like tablet writes smoothly and also offers different layouts to write on, without using much battery. Unfortunately marked text from other PDF viewers is not copied onto the files (PDF or EPUB) when transferring it to the reMarkable. However, annotations made on the reMarkable do show up when you open the file with a PDF viewer afterwards. Although annotation extraction into Zotero is not possible. Changing the order of pages cannot be done on the tablet itself, but a tool such as PDFsam can fix that afterwards. Files can be up- and downloaded either via a USB-cable or using the reMarkable Desktop application that can automatically synchronize. For highlighting Eva missed colour, although for Sytze the three shades of grey were sufficient. Some drawings do look a little pixelated on another screen and the files cannot be paired with existing applications such as Dropbox. Sytze used the reMarkable for designing observation sheets and conducting a user experiment with the pre-designed sheets as a template on the tablet. Although it took some time exporting the design onto a laptop to duplicate the pages using PDFsam and upload the template onto the reMarkable, it meant she only carried one lightweight tablet and did not have to fuss with paper or attract the attention of the participants during the observation.

Several tools could help researchers achieve a “Digital hybrid workflow” with applications such as Dropbox, Zotero or Evernote or devices such as an iPad Pro or reMarkable. Although all these technologies have their positive and negative sides, these tools may not work for everyone in the same way. Thinkering with tools to facilitate your research can help you establish a digital workflow, which is as important as exploring the digital methods used.

This post originally appeared on the C2DH website.

‘As We May Think’ – part 6

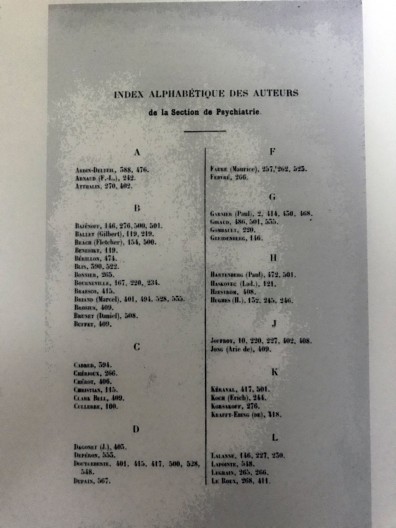
After the information is recorded and stored, it can only be improved upon by adequate consultation. However before computers and especially the World Wide Web existed, information was always presented in a linear way in books or encyclopedias. Sometimes they contained an index, but Bush already noted that “our ineptitude in getting at the record is largely caused by the artificiality of systems of indexing”.[1] Data were usually stored alphabetically or numerically and having found one item, the process starts again from the beginning. The author goes on saying:

The human mind does not work that way. It operates by association. With one item in its grasp, it snaps instantly to the next that is suggested by the association of thoughts, in accordance with some intricate web of trails carried by the cells of the brain.[2]

Hypertext links related pieces of information and by selecting words users can receive additional information such as a definition or related references. These links also connect text to pictures, audio and video. Unlike the linear sequence of entries in physical and thus static printed encyclopedias, hyperlinked information follows a treelike or network structure with direct and unmediated links to related information.[3] “Semantics are encoded in both the textual nodes and the graph of links,” but this can create a semantic gap between authors and readers.[4] With the rise of the web hypertext is increasingly used as a less formal logic representation, whereas the Semantic Web facilitates machine to machine communication using formal and restrictive languages. In order for human users to understand these logic representations the “translate to hypertext” produces less formal content and links.[5]

[1] Bush. As We May Think. Chapter 6.

[2] Idem.

[3] 2016. Hypertext. Encyclopaedia Britannica. Britannica Academic. Consulted 5 march 2016. http://academic.eb.com.kuleuven.ezproxy.kuleuven.be/EBchecked/topic/279726/hypertext.

[4] David E. Millard, Nicholas M. Gibbins, Danius T. Michaelides and Mark J. Weal. 2005. Mind the semantic gap. Proceedings of the sixteenth ACM conference on Hypertext and hypermedia. ACM, New York, NY, 54.

[5] Ibidem, 55.

Mapping Leuven in 1649 with QGIS

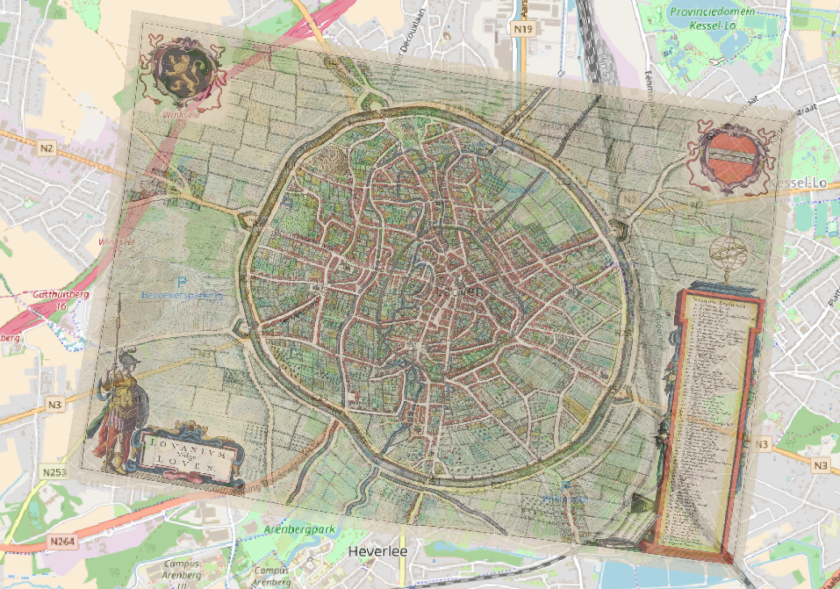
On the 11th and 14th of May, dr. Catherine Jones introduced us to Geographical Information Systems (GIS) with the help of Kerry Schiel and Kaarel Sikk. On the first day we mostly learned how to work with QGIS uploading existing maps and exploring the Bombsight maps. We also started from scratch ‘stitching’ an old map to the open street map or google maps based on points that we could still recognise and overlap. Depending on how recent and/or accurate the historic map was, we had to choose a different transformation type. After wasting time locating buttons during the tutorial because the interface wasn’t entirely intuitive and many of the concepts were new, we got the hang of it. For the assignment, I decided to repeat the process with an historic map from Leuven where I was born and where I spent six years at the university. Since the resolution of the map I tried to use during the tutorial was too low, I found a more recent map (from 1649, rather than 1541) from the Atlas van Loon. Before uploading the historic map, I set the projection to TRS89 / Belgian Lambert 2008. Although Leuven has changed a lot the last four centuries, I could stitch the map mostly based on the locations of churches still in existence today. I have to admit that being a local really helped me locate some of these rather quickly. Once the eleven points were identified on the open street map, I used the Thin Plate Spline which stretches the historic map as if it were made of rubber because that made most sense for this rather old map.

schermafbeelding 2018-06-04 om 11.14.37

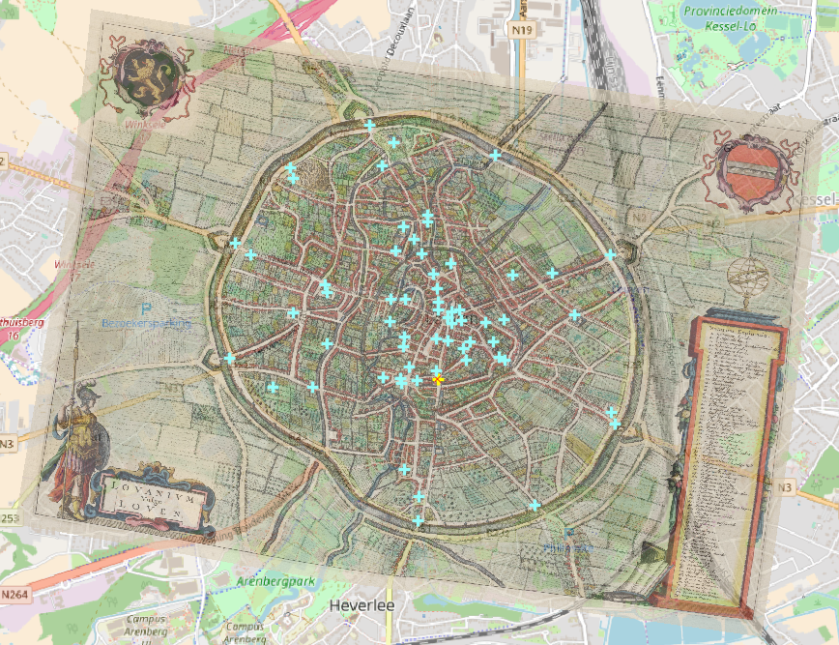
At the end of the first day and the beginning of the second day we learned how to insert and adapt data points such as locations of bombs that fell on a certain day of the week, or flight paths and areas affected by larger bombs in London. For my own project I decided to locate the original items of the legend and used the number of the location in the original legend as an id and the name of the item in a second field of the data table. At first I tried to find the buildings and locations (mostly churches, colleges and squares) in the order of the original legend, but after a serious struggle to find nr. 11 on the list, I decided to systematically look at areas of the maps and locate the numbers of the legend first before adding a data point. Once I finished locating most of the points, I looked at the data table once more and realised I had made at least two mistakes by identifying the same building twice on different locations. Luckily the points on the map light up if you select a row in the data table which made it easy for me to correct the errors. In the end I made a list of all the legend items I didn’t find and found a list and links to the heritage inventory that were useful in a final attempt to locate them. I managed to find two more buildings, but 11 out of 74 were not to be found (even though for some I knew for sure where they were).

schermafbeelding 2018-06-04 om 11.22.49

I can add labels and some more metadata to the dots, for example which type of building it is (university or religious building) and give those a different color. Another option is to outline the original city walls (the ‘binnenring’ and ‘buitenring’) or identify which areas contained housing, where the gardens were, and which plots were used as agricultural areas. In any case I really enjoyed the workshop and learned a lot, only time held me back to add extra data layers. The interface has a learning curve, yet can be very useful.